
Agronometrics in Charts: Blueberry prices rising in U.S. market despite higher volumes
In this installment of the ‘In Charts’ series, Cristian Crespo of Agronometrics illustrates how the U.S. market is evolving. Each week the series looks at a different horticultural commodity, focusing on a specific origin or topic visualizing the market factors that are driving change.
This week in “In Charts” we will take a look at how average blueberry prices and volumes have been doing in the U.S. market, specifically by type (conventional and organic) and origin.
Average blueberry prices in the U.S. market this year have followed the regular curve but have had higher prices year on year. Marked differences have been seen between weeks one and seven, weeks 13 and 18 and now between weeks 32 and 36.
Prices are higher despite the fact that in these last weeks, blueberry imports in the U.S. saw a 35 percent increase in value year on year.
The graph below shows that conventional blueberry prices in week 36 were US$7.74 per kilogram, a 51 percent increase year on year. Currently, prices of blueberries from Canada, Michigan, Peru, Washington and Oregon are being recorded.
Average prices of conventional blueberries in the U.S. market (USD/KG)
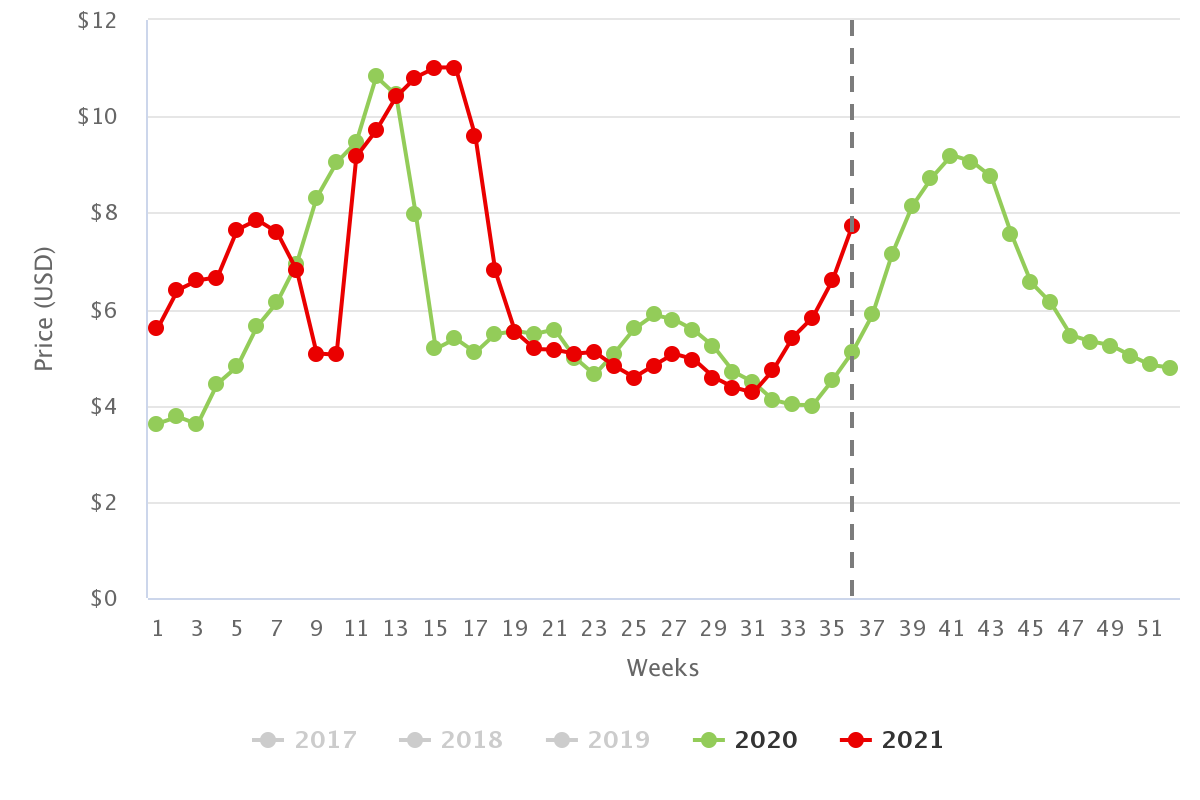
(Source: USDA Market News via Agronometrics) [Agronometrics users can view this chart with live updates here]
Regarding organic blueberries, a similar situation to conventional blueberries occurred, although with a difference of less magnitude compared to non-organic blueberries that can be seen in the graph below.
The average prices of organic blueberries in week 36 were US$11.32 per kilogram, a 24 percent increase year on year. Currently, prices are being recorded from Peru, Washington and Oregon.
Average prices of organic blueberries in the U.S. market (USD/KG)

(Source: USDA Market News via Agronometrics) [Agronometrics users can view this chart with live updates here]
Blueberry volumes have been higher this year than last between weeks 31 and 34, as is shown in the following graph. Despite this, prices for the fruit have remained on the rise and higher than those of last year. This increase in volume has occurred mainly in conventional blueberries.
Blueberry volume in the U.S. market (KG)

(Source: USDA Market News via Agronometrics) [Agronometrics users can view this chart with live updates here]
We’ll have to wait and see what happens in the future with prices when the Southern Hemisphere (Argentina, Peru and Chile) and Mexican seasons are taken into consideration.
If you would like more information about the global blueberry industry, we invite you to take a look at this study done by the International Blueberry Organization (IBO).
In our ‘In Charts’ series, we work to tell some of the stories that are moving the industry. Feel free to take a look at the other articles by clicking here.
You can keep track of the markets daily through Agronometrics, a data visualization tool built to help the industry make sense of the huge amounts of data that professionals need to access to make informed decisions. If you found the information and the charts from this article useful, feel free to visit us at www.agronometrics.com where you can easily access these same graphs, or explore the other 20 fruits we currently track.
14/09/2021