
Agronometrics in Charts: The role of Mexican blueberries in the U.S. market
Written by: Colin Fain of Agronometrics for the North American Blueberry Council (NABC). Originally published on the NABC website on May 13, 2020.
As Mexico’s season just reached its peak, the opportunity lends itself to look a bit deeper at the origin in the U.S. markets. The rise of Mexican blueberries in the U.S. market has been no small achievement.
In 2010, they represented a mere blip on the map. In 2019, with 75 M lbs, they were the second-largest importer of fresh blueberries to the U.S., second only to Chile, but with Peru trailing closely behind Mexico.
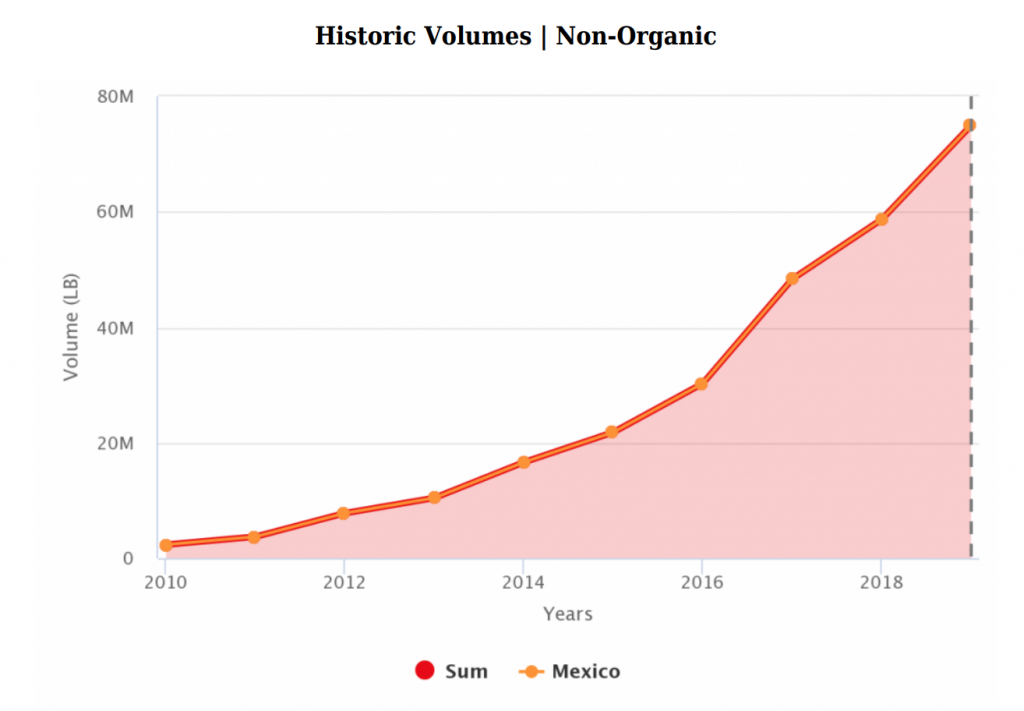
(Source: USDA Market News via Agronometrics. Agronometrics users can view this chart with live updates here)
In 2010, the landscape for blueberries was very different from what it is today. Chile has grown considerably, the U.S.’s production has evened out more, pushing more volume into April and May, and of course, Mexico is now a primary source through this time period.
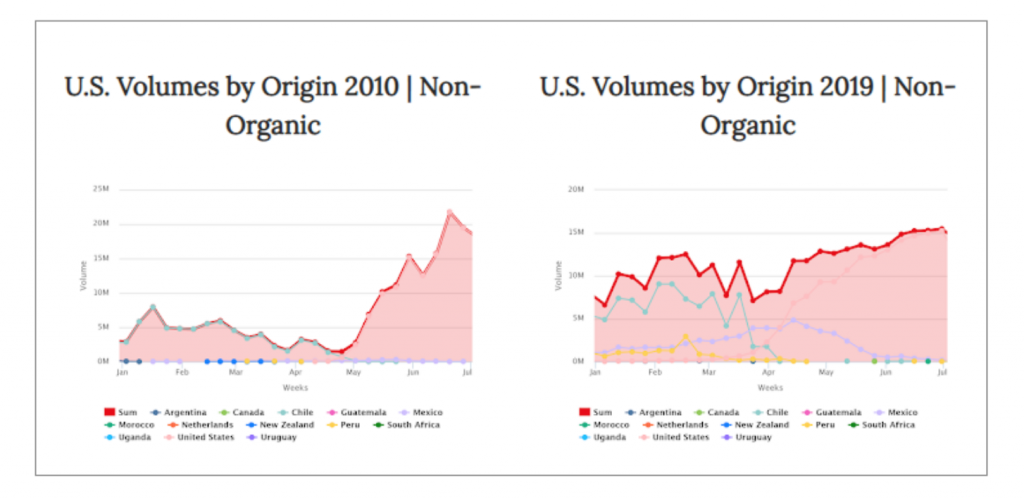
Source: USDA Market News via Agronometrics. Agronometrics users can view this chart with live updates here)
The effects on prices have been equally dramatic. In 2010, a lack of supply pushed prices up to nearly $8 USD/LB, even holding pricing over $6 USD/LB for most of April. Last year, the picture was very different; the highest price the market saw during this time period was $5 USD/LB, maintaining pricing above $3.50 USD/LB for only four weeks around April, where in 2010, prices were above that threshold from January through mid-May.
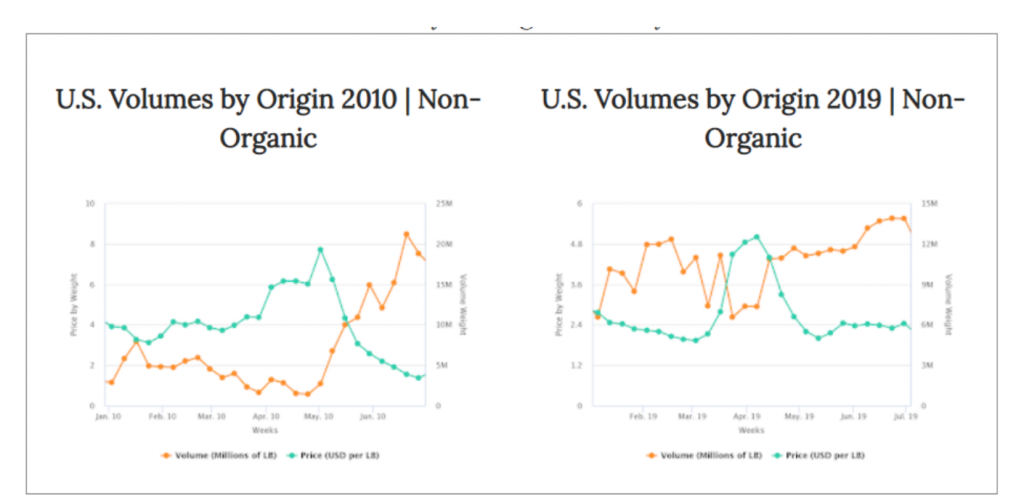
Source: USDA Market News via Agronometrics. Agronometrics users can view this chart with live updates here)
Clearly, this is a new market. However, the fundamentals remain the same, the laws of supply and demand still dictate price. And as production has increased, coming ever closer to a steady year-round supply, prices have followed suit. Mexico has definitely contributed to this increase, but it’s clearly not the only origin to do so.
The biggest beneficiary of this massive change is retailers’ ability to sell this increasingly consistent supply to consumers. As supply has stabilized, consumers who can now maintain their blueberry purchasing habits throughout the year have been pouring more and more money into the category, making it one of the fastest-growing fresh produce items in the country.
From what the data can tell us, Mexican fruit appears to be well-received by the markets. Since the first prices for Mexican fruit were reported in 2013, their blueberries have earned an average premium of $0.30 USD/LB when compared to the overall market average.
Prices by Origin 2019 (USD/LB) | Non-Organic
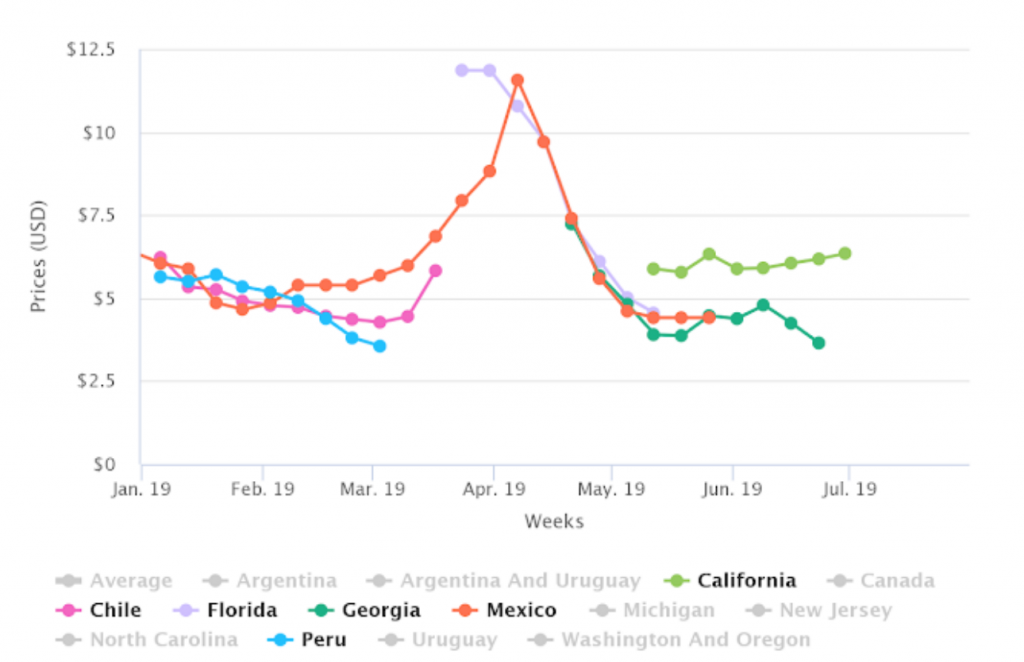
(Source : USDA Market News via Agronometrics. Agronometrics users can view this chart with live updates here)
Although seasonality and geography also have a big impact on pricing, Mexican fruit appears to hold its own on the market.
It’s generally considered that blueberries at the beginning of their season are better quality than toward the end. When looking at pricing for the different origins, this is exemplified by the end of Chile’s and Peru’s campaigns where Mexican fruit is still building strength and receiving a strong premium.
Florida’s pricing usually presents a big jump over other origins right at the beginning of the season, presumably as it satisfies an otherwise underserved regional market. Once things even out though, Mexican fruit has demonstrated an ability to hold its value uncharacteristically well, compared to other origins, as the bulk of its season comes to an end. FreshFruitPortal.com
This year, like Florida, Mexico’s production was equally hit by Covid-19. Right at the peak of production, pricing deflated about three weeks early. The reasoning and effects are similar to what was described in the previous article, and without a doubt a resounding disappointment for the industry as a whole.
Historic Prices from Mexico (USD/LB) | Non-Organic
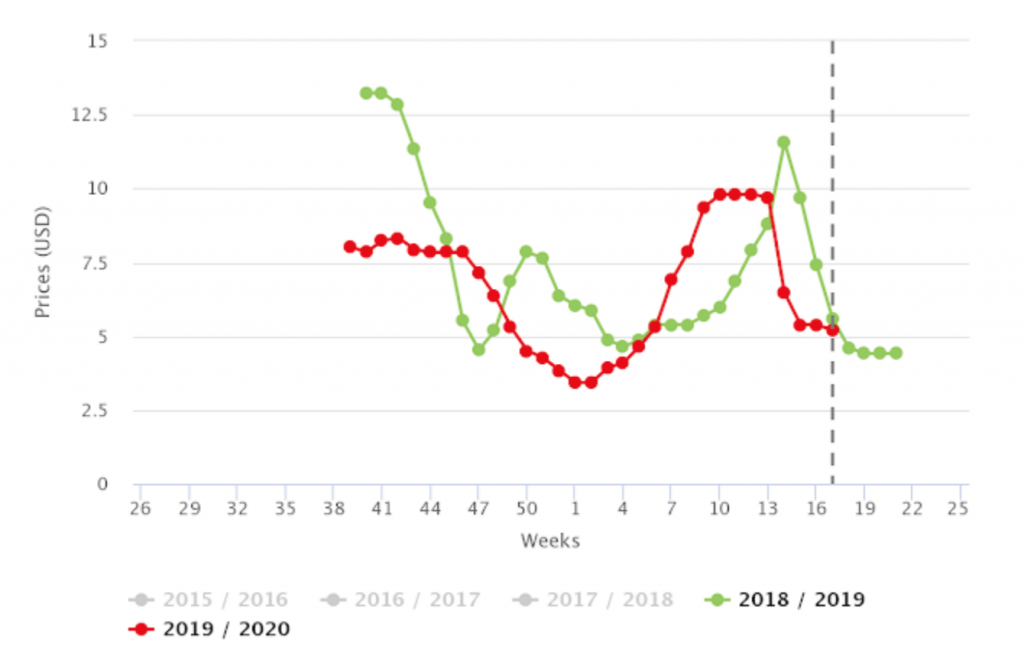
(Source: USDA Market News via Agronometrics. Agronometrics users can view this chart with live updates here)
There are other factors to keep in mind that also help Mexican production offer a competitive product. From a purely economic perspective, Mexico also can currently take advantage of the strength of the dollar, which in 2010 averaged around 13 Mexican Pesos per U.S. dollar, whereas in 2019, the average had shifted to around 19 pesos per U.S. dollar.
This more favorable exchange rate means that U.S. dollars earned by Mexican exporters can buy more Mexican pesos in their market. With Mexican production costs in pesos, U.S. dollar revenues, earned by Mexican blueberry exporters offer 30% more capital to help run their operations.
This currency exchange advantage has grown in 2020 with the value of the Mexican peso falling in the range of 23 and 25 pesos per U.S. dollar since the end of March. Bloomberg offered an interesting article on the drivers of these recent currency exchange rate fluctuations, for those that might be interested in digging deeper.
For the fresh produce exporters, this is welcome news however, any kind of massive shift in exchange rates can be a double-edged sword. Given that this factor is not controlled by the industry, it’s risky to expect that these rates will remain as they are. Just as fast as they rose, they could also fall. Any imports that the industry relies on will also be hit by higher relative local prices.
19/05/2020